Image segmentation of roofs in overhead satellite views
1. What do we do?
Satellite imagery has been found to be useful in wide variety of applications such as meteorology, conservation of biodiversity and city planning. Satellite images provide clear and accurate representation of the atmospheric motion, geological changes and aids in forecasting and planning.
In urban planning and development, satellite images are studied to draw up accurate overhead maps of buildings. The roof segmentation in such images is useful in 3- dimensional reconstruction of cities to identify spots for installation of solar panels.
Semantic segmentation of the satellite images for rooftops tries to identify and segment the planar structures in roofs. It involves classifying each pixel into binary class of whether they contain a roof or not. Further, the pixel labels are clustered into segment groups.
In this blog, we look at a fully convolutional encoder-decoder based architecture with skip connections that can extract context and provide precise localization for the rooftop segmentation. Further, we explore data augmentation techniques to provide sufficient images for model training and reduce computation constraints.
2. The data that we use
The model training and inferencing has been performed on Inria Aerial Image Labeling Dataset. This is a publicly available dataset which covers urban settlements ranging from densely populated areas to alpine towns. It covers five main regions- Austin, Kitsap, Chicago, Vienna and West Tyrol with 36 image per location. Image resolution of this dataset is 5000*5000 pixels. The dataset is aerial orthorectified color imagery. It also contains the ground truth for two class building and non-building for the training data.
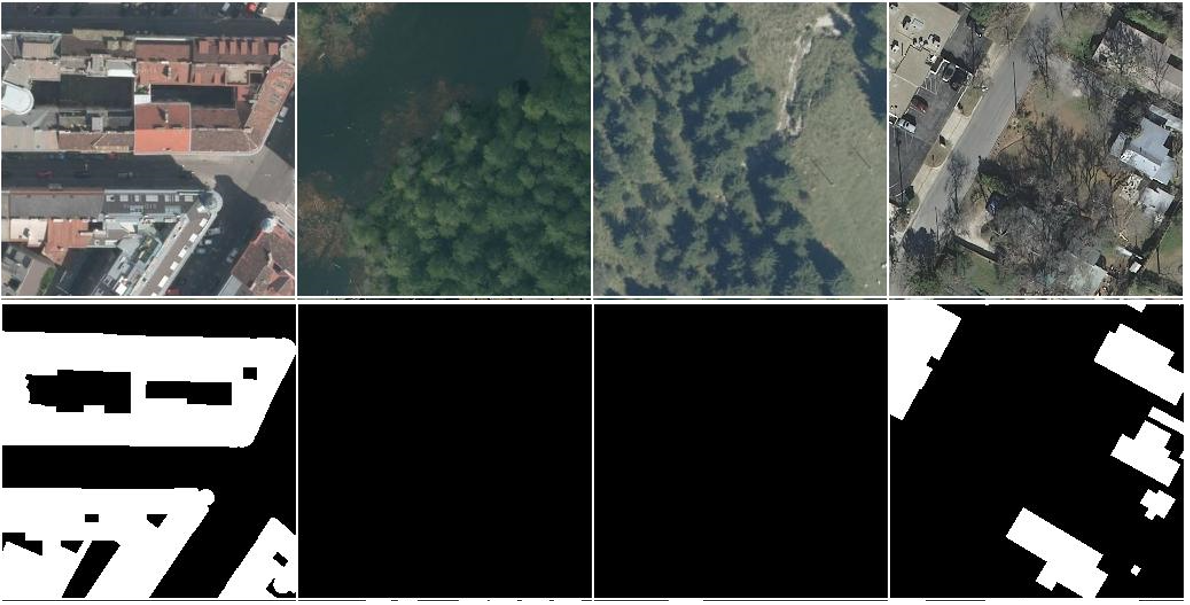
Large spatial scale of the satellite images hampers training on available hardware. Also, the small scale of the dataset is not effective for meaningful training. To overcome these challenges, each image is tiled in a non-overlapping manner to provide tiles of 1000 x 1000 pixels. Further, these tiles are random cropped into patch of 256 x 256 pixels at the point of training. Spatial structure of the satellite and mask images are retained during random cropping. Further we have provided option of applying random rotation to increase data augmentation. These have not been applied in the current run. We have also explored the option of resizing the tiles instead. These results are discussed below. After the data augmentation, we have 14400 images for training and 3600 images for testing.
3. Designing the model
Semantic segmentation is a dense prediction task. That is, the prediction’s resolution is same as that of the input. For this purpose, an encoder-decoder architecture has been implemented. The rationale behind the proposed model is that the encoder learns the features of the input image (edges, gradients, parts of the object) and the decoder utilizes these features in providing an accurate segmentation map. The proposed model called SatUMaskNet is based on UNet, a state-of-the-art model for medical image segmentation.


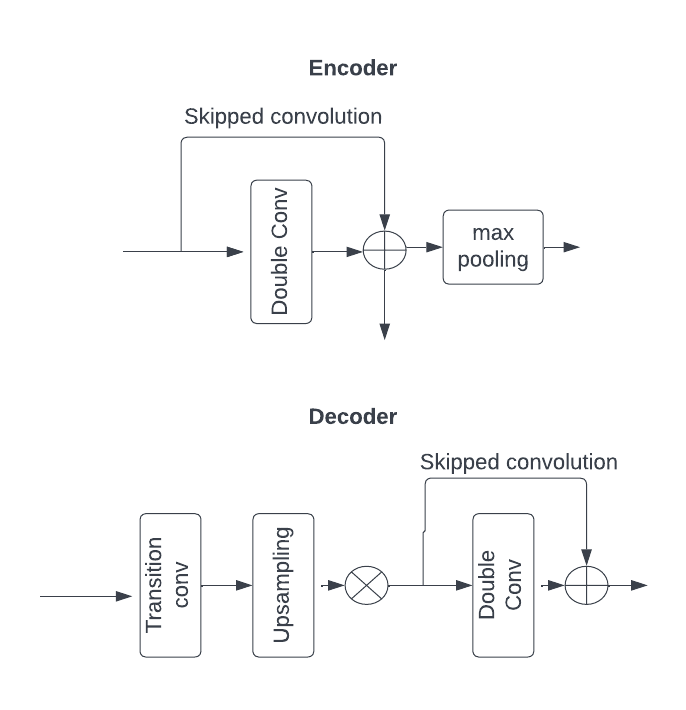
The proposed model has 4 blocks each of the encoder, decoder segment. Double convolution block is first applied on the input image before feeding to the encoder block. The double convolution block has two layers each of 3x3 convolution, ReLU activation and batch normalization. The encoder block consists of double convolution block and a skip connection. The skip connection bypasses the 3x3 convolution block and sums with its output. Pointwise convolution is applied on the skipped connection to match the convolution output in the channel dimension. Later, Maxpooling is applied to reduce the spatial dimension of the feature map by half.
The decoder block applies up sampling on the feature map. The decoder also takes the encoder output from the same feature level as input. The upsampled output is concatenated with encoder feature map. Further 3x3 double convolution is applied on this output. Decoder block also uses skip connection with pointwise convolution to match the skip connection’s channel dimension with the convolution output. The proposed model is considerably lightweight with 7.5 million parameters.
4. Teach the model
Binary cross entropy loss and dice loss has been used to calculate the overall loss. Binary cross entropy loss provides a large penalty when incorrect predictions are made with high probability. Dice loss is calculated by taking the difference of Dice coefficient from 1. Dice coefficient provides the measure of overlap between the ground truth and the predicted output
\[Dice\ Loss=1\ -\ (2\ .\ |X\ \cap\ Y|)/(|X|\ +\ |Y|)\]5. How to train?
The network is trained with (SGD) Stochastic Gradient Descent optimizer with Learning rate of 0.01 and momentum to 0.9. Based on the paper by Leslie Smith, the learning rate of the parameter group is set according to the 1 cycle learning rate policy. This is especially useful in our run as the number of epochs trained is quite low due to resource constraints. The model has been trained for 8 epochs.
6. Result?
Model training has been performed with UNet and our proposed model SatUMaskNet. We have also trained our proposed model on two augmentation methods –
a) with random crop of 256x256 patch size
b) with resize of 256x256 patch size.
Dice score is used as a performance measure for the comparison.
| Method | Data augmentation | Dice score |
|---|---|---|
| UNet | Random crop, 256 | 0.548 |
| SatUMaskNet | Random crop, 256 | 0.475 |
| SatUMaskNet | Resize, 256 | 0.55 |
The table above shows the comparison of the two models with different data augmentation techniques. UNet model, with maximum channel size of 1024 and 31 million parameters gave Dice score of 0.548. Our proposed model SatUMaskNet has a maximum channel depth of 512 and 7.5 million parameters gave a Dice score of 0.475. We feel there is potential for further improvement in both the models with better data augmentation analysis. The proposed network was also trained on resized tile images of 256x256 pixel which gave a score 0.55.

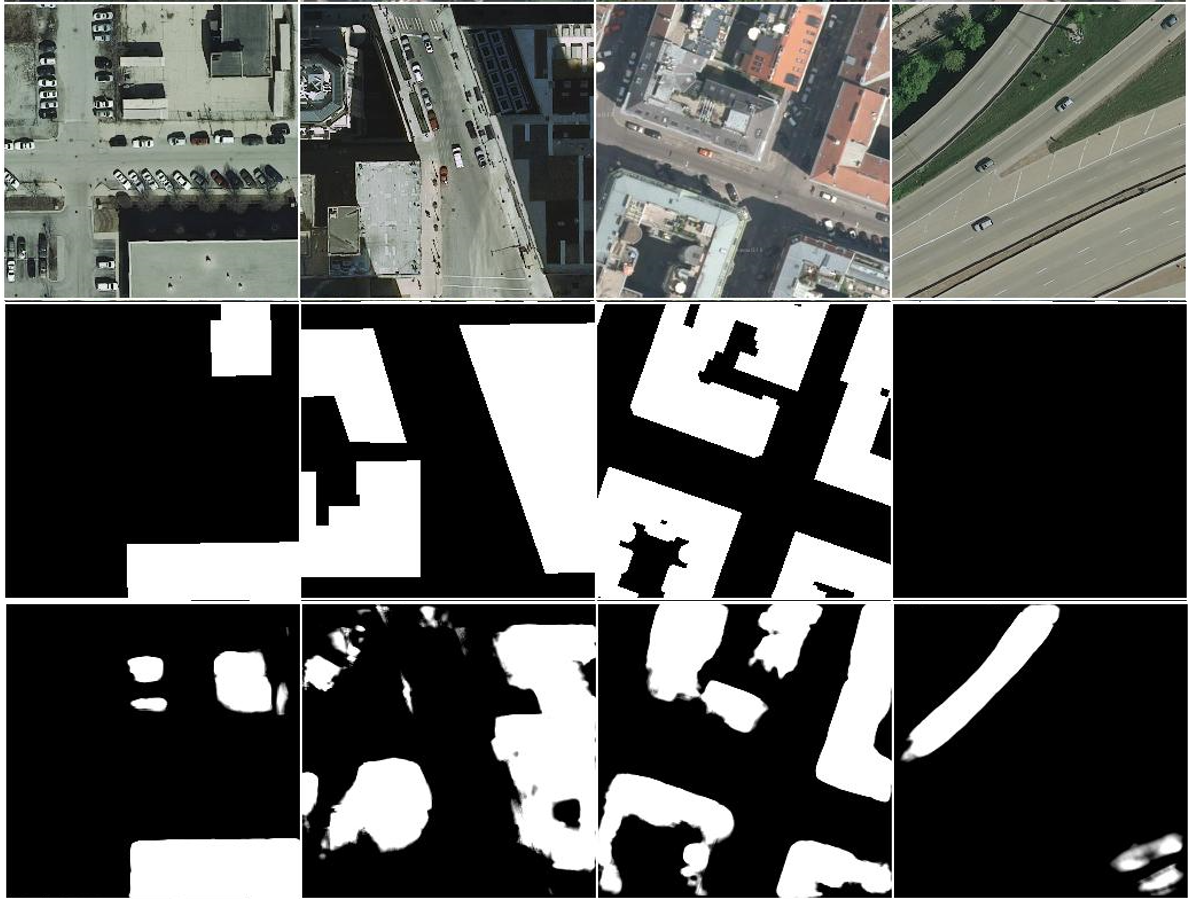
The image below shows the image segmentation results for our proposed network with resized data augmentation. The predicted mask segments show close resemblance to the ground truth. In some cases, the predicted mask lacks clarity and sharpness in the defined straight edges when compared to the ground truth.

7. Discussions
Many of the state-of-the-art papers for image segmentation typically use deep networks and may suffer from vanishing gradients problem without careful hyperparameter tuning. Many of the recent vision-based transformer models would require large scale training data to produce comparable results. In this implementation, we have explored a lightweight fully convolutional network with less parameters. However, there are a few notable observations in our proposed network that need further evaluation.
7.1. Data Augmentation Analysis

In this approach, we proposed tiling of satellite image into 1000x1000 pixel tiles and then random cropping 256*256 pixel patch for training. This spatial size of the training patch was taken while keeping the resource constraint into consideration. But during our analysis of the results, we have observed patches for training and inference which did not contain the rooftop segments.
Most of the times, image segmentation tasks are high data imbalanced problems. In our case specially, the satellite images are of very high resolution and have minute presence of rooftops. As shown in the above figure, with the chosen patch size, there are many occurrences of such patches for training and inference. This requires further evaluation of the ideal image patch, overlapping area and requirement of resizing to provide data for training.
7.2. Occurrence of False positive

On review of the model training results, there were observations of false positives in the model’s prediction. As shown in the rightmost column in the above figure, the satellite image patch used doesn’t contain rooftops. The ground truth of the satellite image (shown in the middle row) also shows no presence of rooftops. But the model has falsely predicted rooftops during inference. There are such occurrences that need further analysis. We would like to include this observation as well in our future work. Stronger heuristics along with the proposed deeper network and refined data augmentation may help in solving this error.
8. Finally..
In this approach, we have explored a lightweight fully convolutional encoder-decoder with skipped connections network to solve semantic segmentation of high-resolution satellite images. We have explored data augmentation techniques keeping resource considerations in mind. From model inference and observations, we have identified few key limitations which we have discussed above.
With respect to future work, we plan to explore with other convolution techniques such as dilated convolutions, pixel shuffle proposed by Shi and experiment with deeper network. We will further improve and try to identify the optimal data augmentation that can help the model in providing accurate, localized segment maps.
Enjoy Reading This Article?
Here are some more articles you might like to read next: